


- XRP price indicators send multiple buy signals, supported by low exchange inflows.
- The SuperTrend turns green for the first time since March, setting the stage for gains toward $3.00.
- Surging long positions liquidations alongside falling Open Interest may slow XRP’s uptrend.
Ripple (XRP) price continues its upward trajectory, trading at $2.40 on Monday, fuelled by a widespread bullish surge spearheaded by Bitcoin (BTC) breaking past the $100,000 mark last week. Multiple buy signals from crucial indicators suggest that XRP can potentially extend the rally, targeting $3.00 in the coming days, especially if the derivatives market Open Interest (OI) recovers.
XRP turns green amid waning exchange inflows
XRP’s price has broken above a long-term descending trendline resistance, mirroring positive sentiment across the crypto market. The uptrend above the trendline comes amid a major slump in exchange inflows from over 2 billion to 14.5 million XRP, per CryptoQuant data.
Falling exchange inflows often signal reduced sell-side pressure, as investors prefer to hold onto their tokens in self-custody as opposed to moving them to exchanges.
-1747020471030.png)

Exchange inflows | Source: CryptoQuant
Meanwhile, the daily chart reveals a solid bullish structure supported by multiple buy signals. The SuperTrend recently shifted below XRP’s price, supporting the ongoing uptrend. This trend-following indicator signals when to buy and when to sell.
When XRP’s price is above the SuperTrend line, it signals a bullish momentum. For instance, around late November 2024, the price broke above the Supertrend line, marking the start of a major bullish phase that propelled XRP from around $0.50 to a peak near $3.38 by mid-January.
With the SuperTrend line below XRP’s price, dynamics could favour a larger-than-expected breakout aiming for highs above $3.00.
The Moving Average Convergence Divergence (MACD) indicator shows a clear uptrend above the center line. The MACD line (0.0557) above the signal line (0.0318) signals a robust bullish momentum.
Similarly, the expanding green histograms confirm this short-term bullish outlook, corroborated by the Relative Strength Index (RSI) at 61.77. The RSI indicator shows that XRP is neither overbought nor oversold, leaving room for more bullish wiggle.
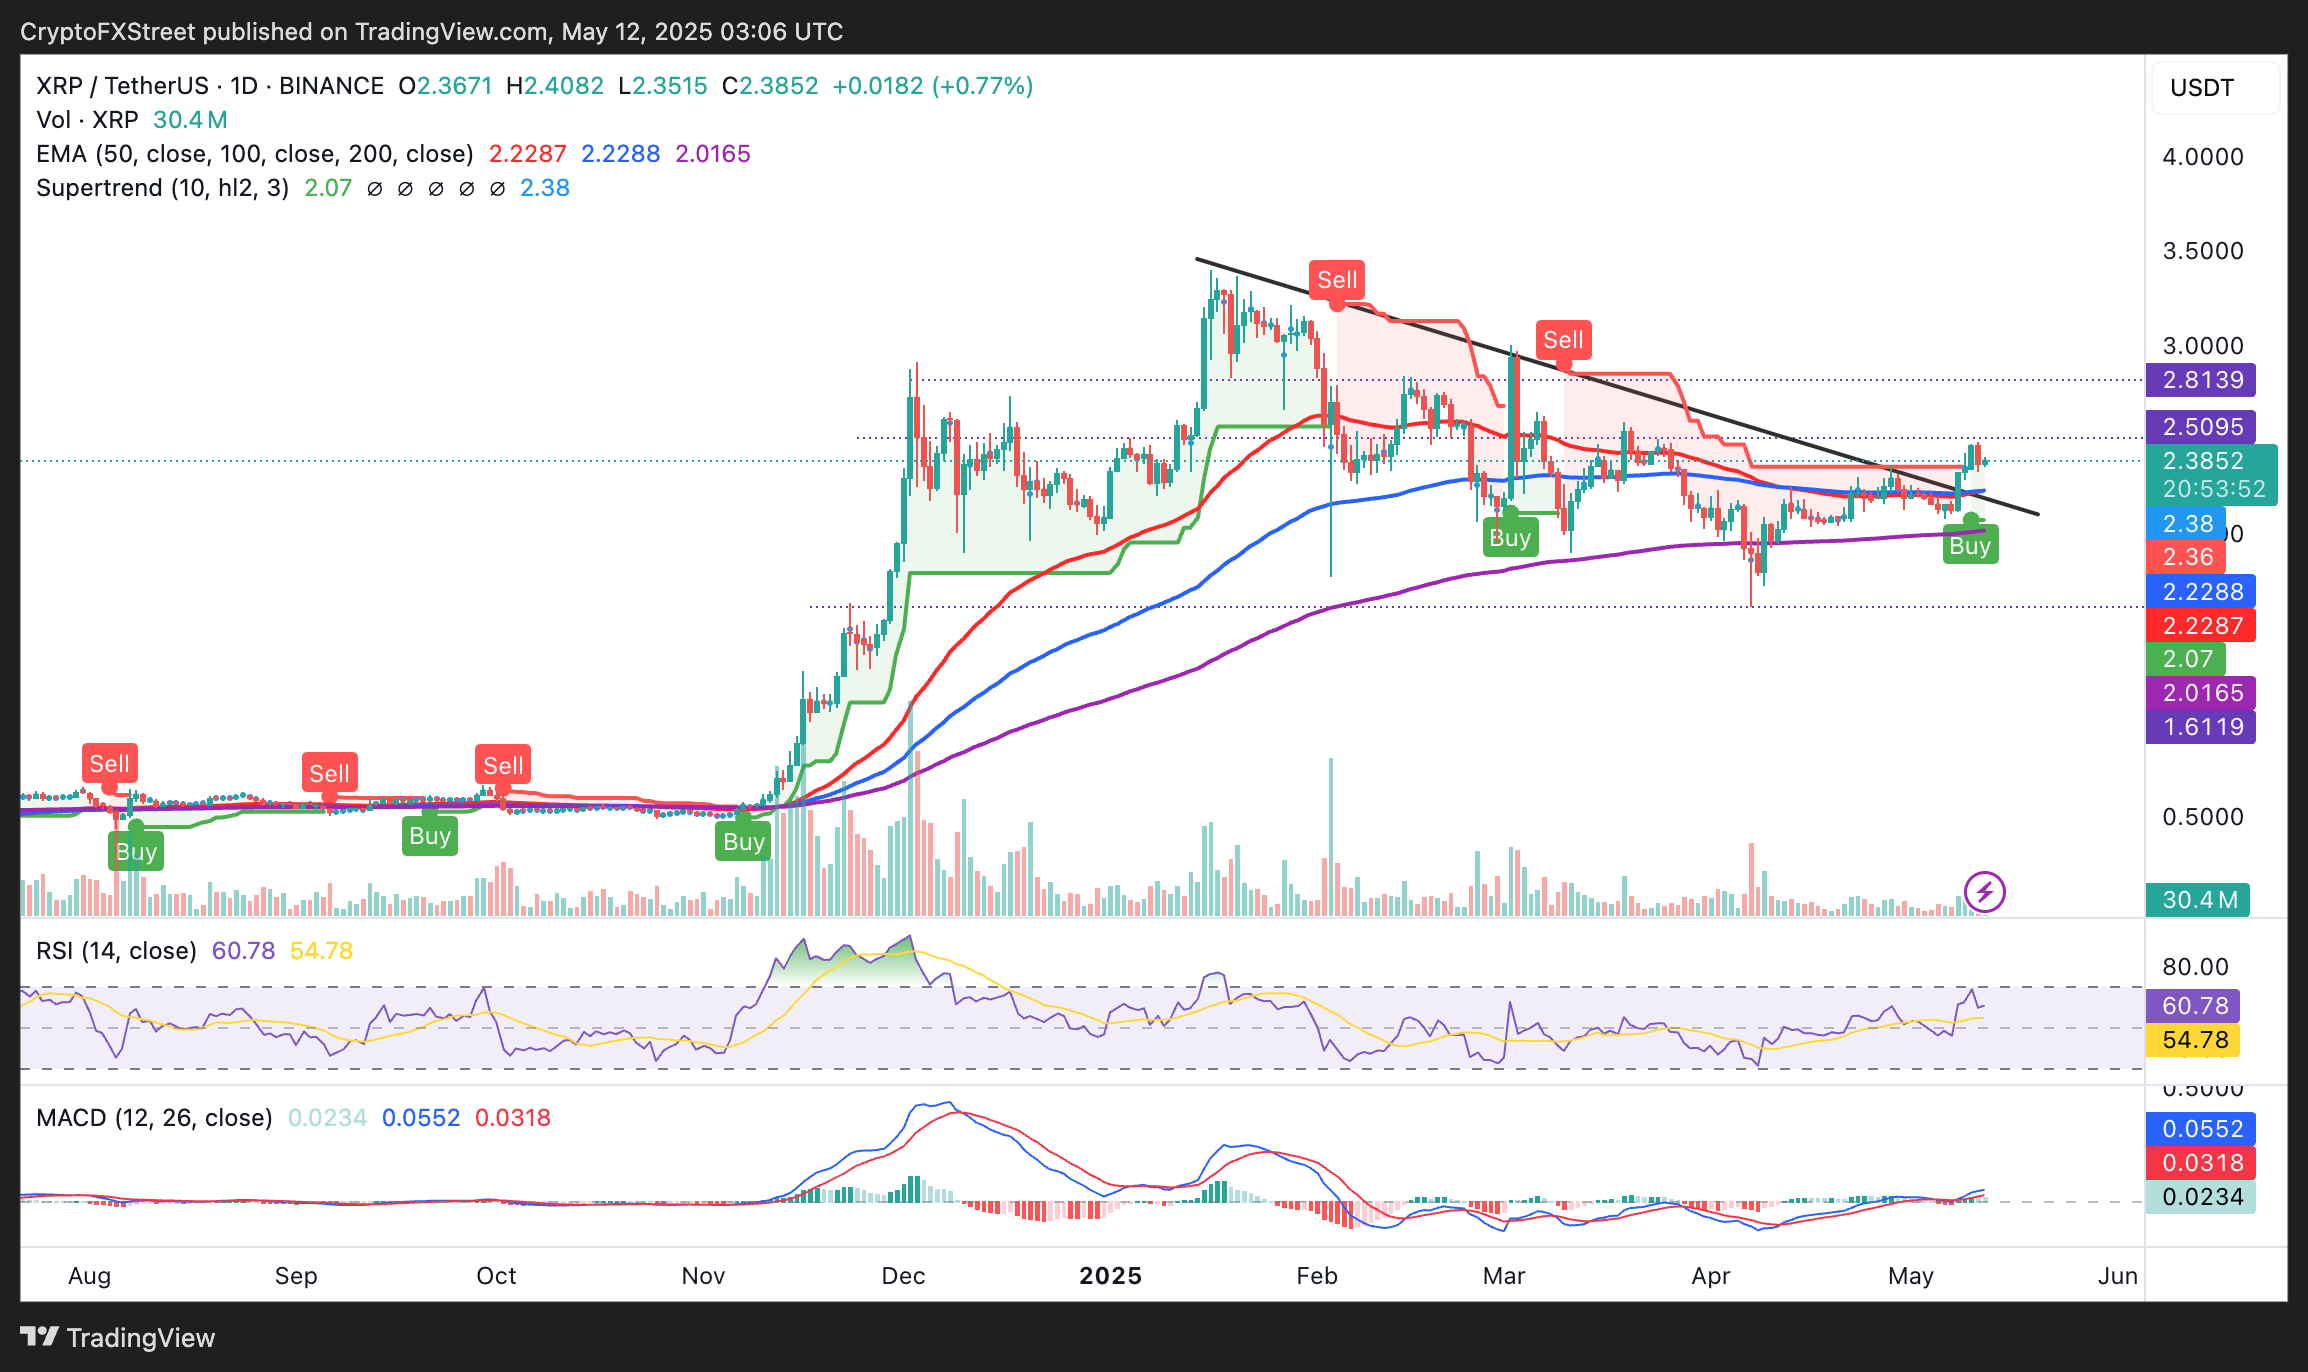

XRP/USDT daily chart
Declining Open Interest may hinder XRP’s upward momentum
Derivatives data from CoinGlass reveals a 2.21% drop in OI to $6.64 billion and a 27.24% decline in the trading volume to $5.74 billion. OI represents the total number of outstanding derivative contracts that haven’t been settled, like futures or options.
When OI falls, it signals that traders are closing positions, reflecting reduced confidence or interest in XRP’s price direction. Coupled with the drop in trading volume, the uptrend could face significant challenges.
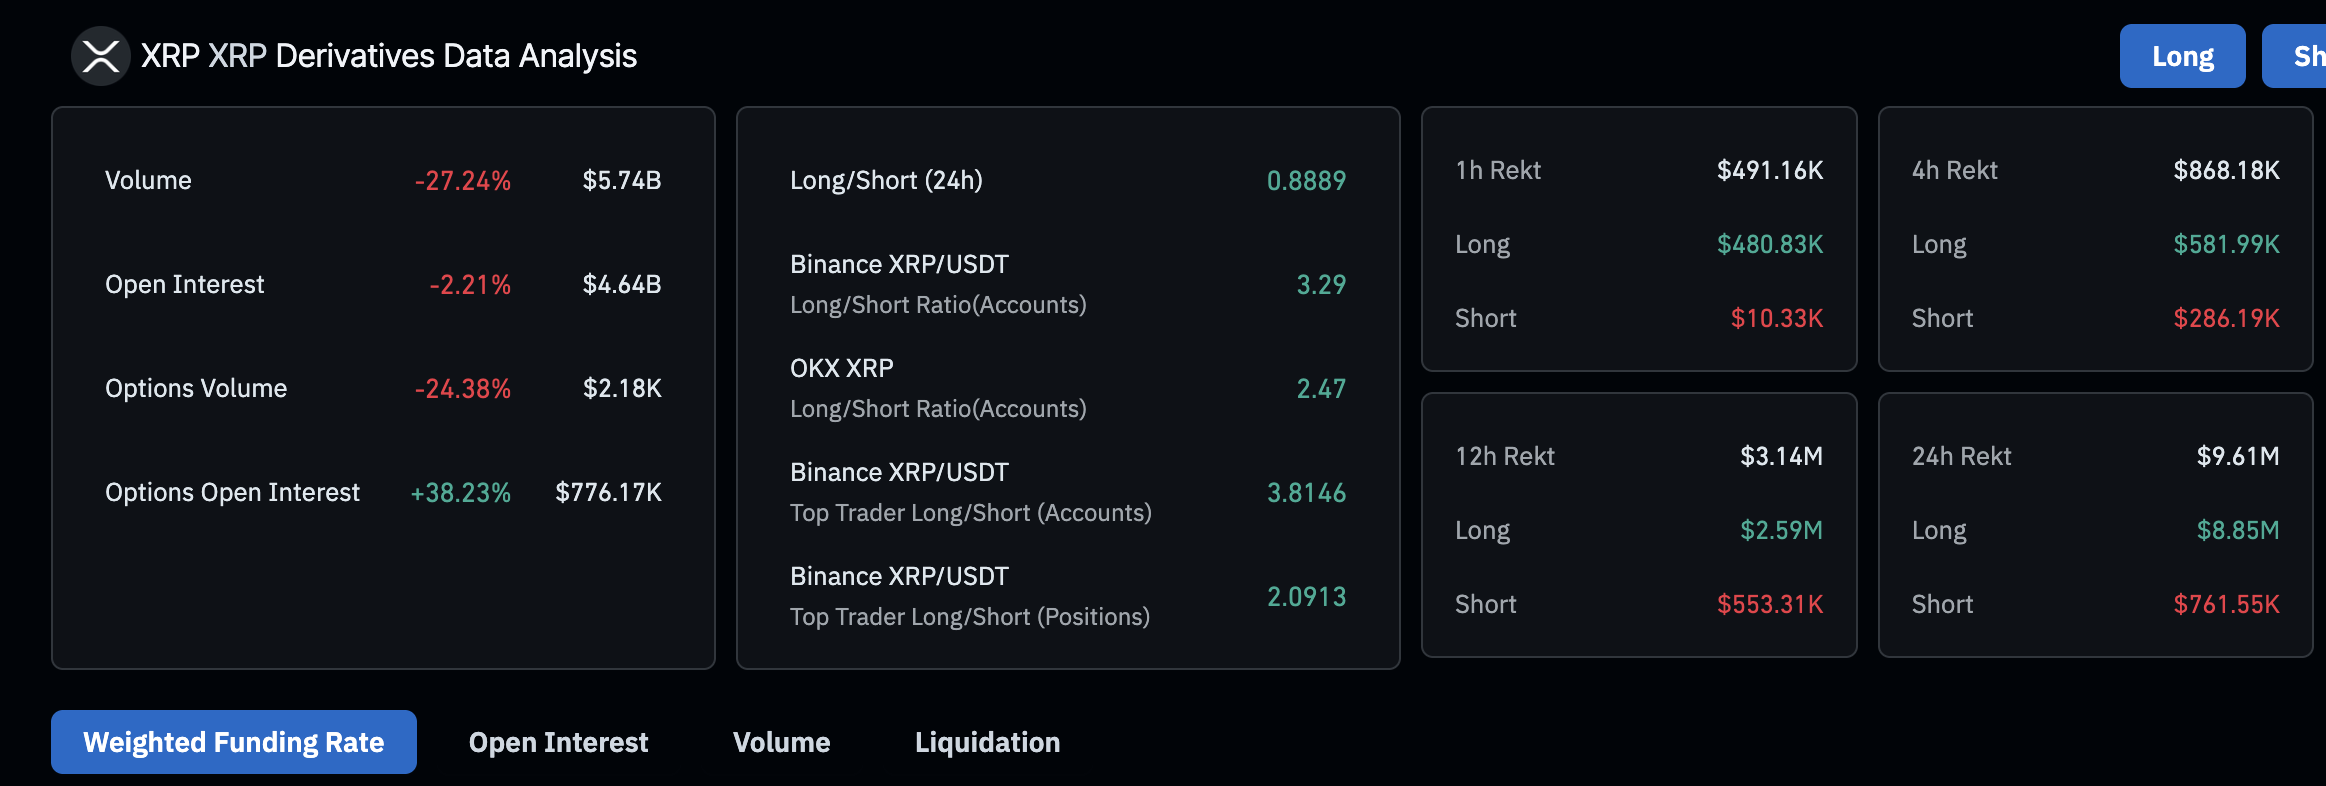

XRP derivatives data | Source: CoinGlass
Long positions liquidation reached $8.85 million in the last 24 hours compared to approximately $762,000 in shorts. A total of $9.61 million has been wiped out, implying that the market is volatile, calling for caution among traders betting on a price increase to $3.00.
Cryptocurrency prices FAQs
Token launches influence demand and adoption among market participants. Listings on crypto exchanges deepen the liquidity for an asset and add new participants to an asset’s network. This is typically bullish for a digital asset.
A hack is an event in which an attacker captures a large volume of the asset from a DeFi bridge or hot wallet of an exchange or any other crypto platform via exploits, bugs or other methods. The exploiter then transfers these tokens out of the exchange platforms to ultimately sell or swap the assets for other cryptocurrencies or stablecoins. Such events often involve an en masse panic triggering a sell-off in the affected assets.
Macroeconomic events like the US Federal Reserve’s decision on interest rates influence crypto assets mainly through the direct impact they have on the US Dollar. An increase in interest rate typically negatively influences Bitcoin and altcoin prices, and vice versa. If the US Dollar index declines, risk assets and associated leverage for trading gets cheaper, in turn driving crypto prices higher.
Halvings are typically considered bullish events as they slash the block reward in half for miners, constricting the supply of the asset. At consistent demand if the supply reduces, the asset’s price climbs.
Information on these pages contains forward-looking statements that involve risks and uncertainties. Markets and instruments profiled on this page are for informational purposes only and should not in any way come across as a recommendation to buy or sell in these assets. You should do your own thorough research before making any investment decisions. FXStreet does not in any way guarantee that this information is free from mistakes, errors, or material misstatements. It also does not guarantee that this information is of a timely nature. Investing in Open Markets involves a great deal of risk, including the loss of all or a portion of your investment, as well as emotional distress. All risks, losses and costs associated with investing, including total loss of principal, are your responsibility. The views and opinions expressed in this article are those of the authors and do not necessarily reflect the official policy or position of FXStreet nor its advertisers. The author will not be held responsible for information that is found at the end of links posted on this page.
If not otherwise explicitly mentioned in the body of the article, at the time of writing, the author has no position in any stock mentioned in this article and no business relationship with any company mentioned. The author has not received compensation for writing this article, other than from FXStreet.
FXStreet and the author do not provide personalized recommendations. The author makes no representations as to the accuracy, completeness, or suitability of this information. FXStreet and the author will not be liable for any errors, omissions or any losses, injuries or damages arising from this information and its display or use. Errors and omissions excepted.
The author and FXStreet are not registered investment advisors and nothing in this article is intended to be investment advice.


Leave feedback about this Cancel Reply